Overview
This year, the Provo Transportation Mobility Advisory Commission (TMAC) is considering obstacles to East-West travel in the city. I requested that this discussion be informed by actual data and analysis rather than feelings or opinions. The city engineer started us off well by looking at existing and future LOS on several East-West corridors. I volunteered to make a presentation to TMAC as well.
Project materials
View the interactive presentation View the analysis and data
The question
LOS is a measure of mobility – how quickly can people (really vehicles) travel along a segment? This measure by itself is not very useful, as people who travel for two hours at LOS A probably have a worse trip experience than people who travel for 5 minutes at LOS D, at least for repeated or frequent trips.
What would an access to opportunity analysis look like for Provo City? How would improvements to East-West LOS actually affect people in getting to destinations at the end of the road?
Data and approach
To answer this question, I combined Point-of-Interest (POI) data for Utah County pulled from OpenStreetMap with congested streets data from the WFRC / MAG travel demand model. I also used a synthetic population for Provo City with households assigned at the parcel level. I measured how many destinations of various kinds people could reach within a certain number of minutes from their home. I then measured how this number changed as we made three roads faster or slower:
- Center Street between Geneva Road and 900 East
- 800 North / 700 North between Geneva Road and 900 East
- 2200 North between University Parkway and Timpview Drive
The slow scenario had vehicles traveling at V/C ratio of 1.1, far exceeding their current LOS. The fast scenario had vehicles traveling at V/C ratio of 0, or free-flow speed. For the Center Street scenario, the fast scenario set a 35 mile per hour free flow speed.
I also tried a scenario where I left the roads alone but added three grocery stores in places with low grocery access.
What I found
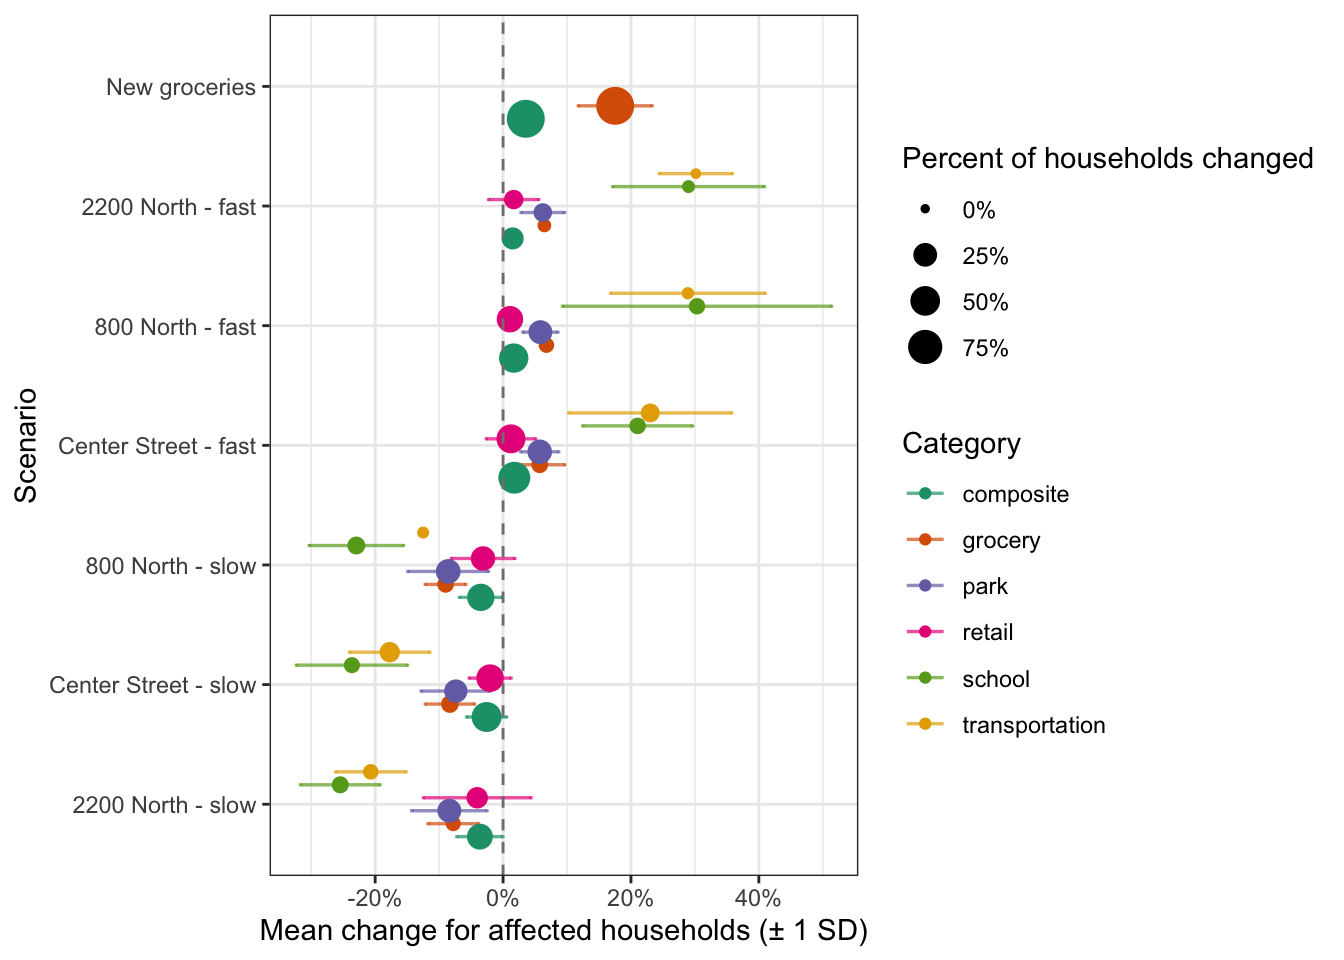
The interactive presentation linked above has maps with the specific accessibility results. As expected, scenarios where roads get faster improve access, and scenarios with roads that get slower decrease access.
The summary of all the scenarios is below.
Finding 1
Land use changes might affect access more than transportation changes. The grocery store scenario has the highest composite change in access, even though only one of the sub-categories changes at all.
Finding 2
This method shows who will benefit and how they will benefit in a way that LOS analysis by itself does not.
Implications for Provo
Provo City should consider access to opportunity analysis in its transportation planning and policy.
Limitations and next steps
This is a demonstration of a potential class of analysis, it is not an actual policy analysis. To implement this methodology in policy consideration, Provo City staff or its consultants should consider more carefully:
- POI and network data correctness,
- Which land uses to consider,
- Which travel time thresholds to use,
- How to consolidate multi-modal travel times,
- How to weight multiple land uses in a composite score.
Another limitation with this method generally is it relies on potential trips, not realized trips. The activity-based model being built for WFRC / MAG would make that analysis possible.
Acknowledgments
I’m grateful for Erin Christesen’s help with some initial data preparation for this analysis. I’m also grateful to OpenAI’s Codex for saving me quite a bit of frustration and reptetitive work. The findings and opinions expressed in this post are my own, and I claim responsibility for any errors or omissions.