Provo City East-West Accessibility

Gregory S. Macfarlane

Civil and Construction Engineering Department, Brigham Young University

2026-08-20

Overview

Mobility vs Accessibility

Transportation must provide two things:

  1. Mobility: the ability to move from one place to another.
  2. Accessibility: the ability to get somewhere to do something.

Level of Service / Delay

Segment “Level of Service” (LOS) is based on traffic density. \[ \mathrm{density} = \frac{\mathrm{flow\ rate}}{\mathrm{speed}} \]

LOS is only a measure of mobility.
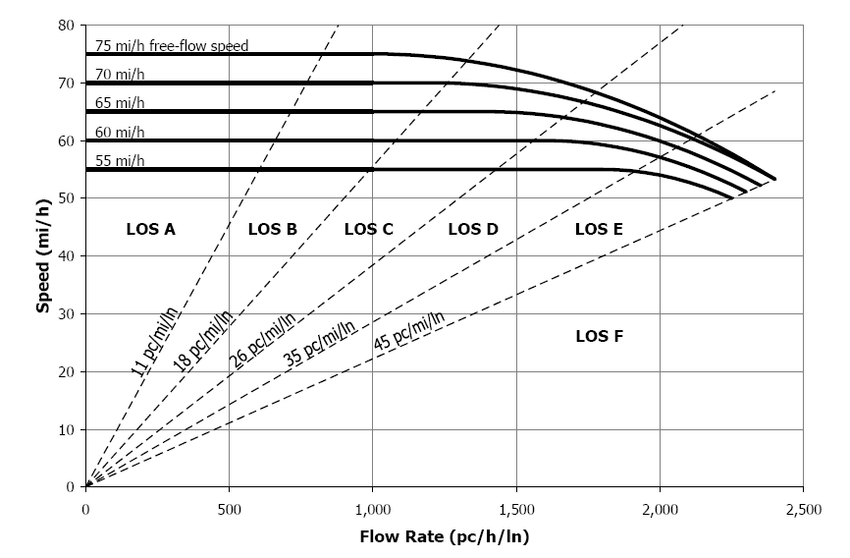
LOS Chart

Mobility vs Accessibility

No one goes there any more, it’s too crowded. – Yogi Berra

It doesn’t matter how long it takes to drive to Orem if the things you want are in Provo.

Accessibility Metrics

  • How many jobs can I reach in 20 minutes?
  • How many customers live within 10 miles of my store?
  • How far away is the nearest grocery store?
  • How much total time do I spend traveling each day?

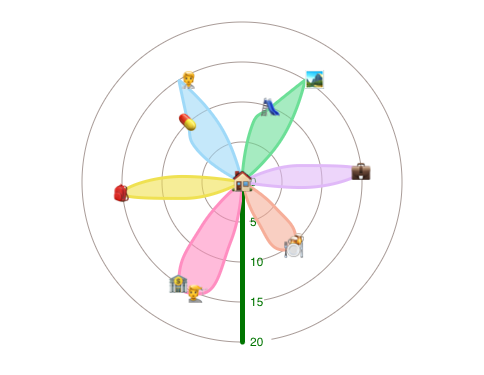
Flowers of Proximity

Flowers of Proximity

Methods for this Project

General Approach

  1. Measure how many destinations households can reach within \(x\) minutes
  2. Identify neighborhoods that are most and least accessible
  3. Observe how accessibility changes with E/W street changes

Points of Interest

  • Provo Elementary schools (5 minutes)
  • Transportation nodes (15 minutes)
    • I-15 interchanges
    • FrontRunner stations
  • Retail (10 minutes)
  • Grocery Stores (10 minutes)
  • Parks (5 minutes)

Points of Interest

Pulled from OpenStreetMap

Network

Wasatch Front Travel Demand Model network, calibrated for 2019 base scenario.

Pros:

  • Congested travel times (PM)

Cons:

  • Not all roads represented
  • Car times only

Travel Time Isochrones

Current Accessibility

Grocery Stores - 10 Minutes

Elementary Schools - 5 Minutes

Transport - 15 Minutes

Composite

Weight each POI type by an asserted importance, and add it up

\[ comp = 0.2 * gr + 0.2 * pk + 0.3 * tr + 0.5 * sch + 0.01 * ret\]

Road Scenarios

Street Network Edits

Now that we have a baseline established, we can consider what would happen if we made some roads faster or slower

  1. 2200 North University Parkway and Timpview Drive
  2. 700 / 800 North between Geneva Road and 900 East
  3. Center Street between Geneva Road and 900 East

2200 North Free Flow Speed (0 V/C)

2200 North Congested (1.1 V/C)

700 / 800 North Free Flow Speed (0 V/C)

700 / 800 North Congested (1.1 V/C)

Center Street Faster (30 mph)

Center Street Slower (1.1 V/C)

Land Use Scenarios

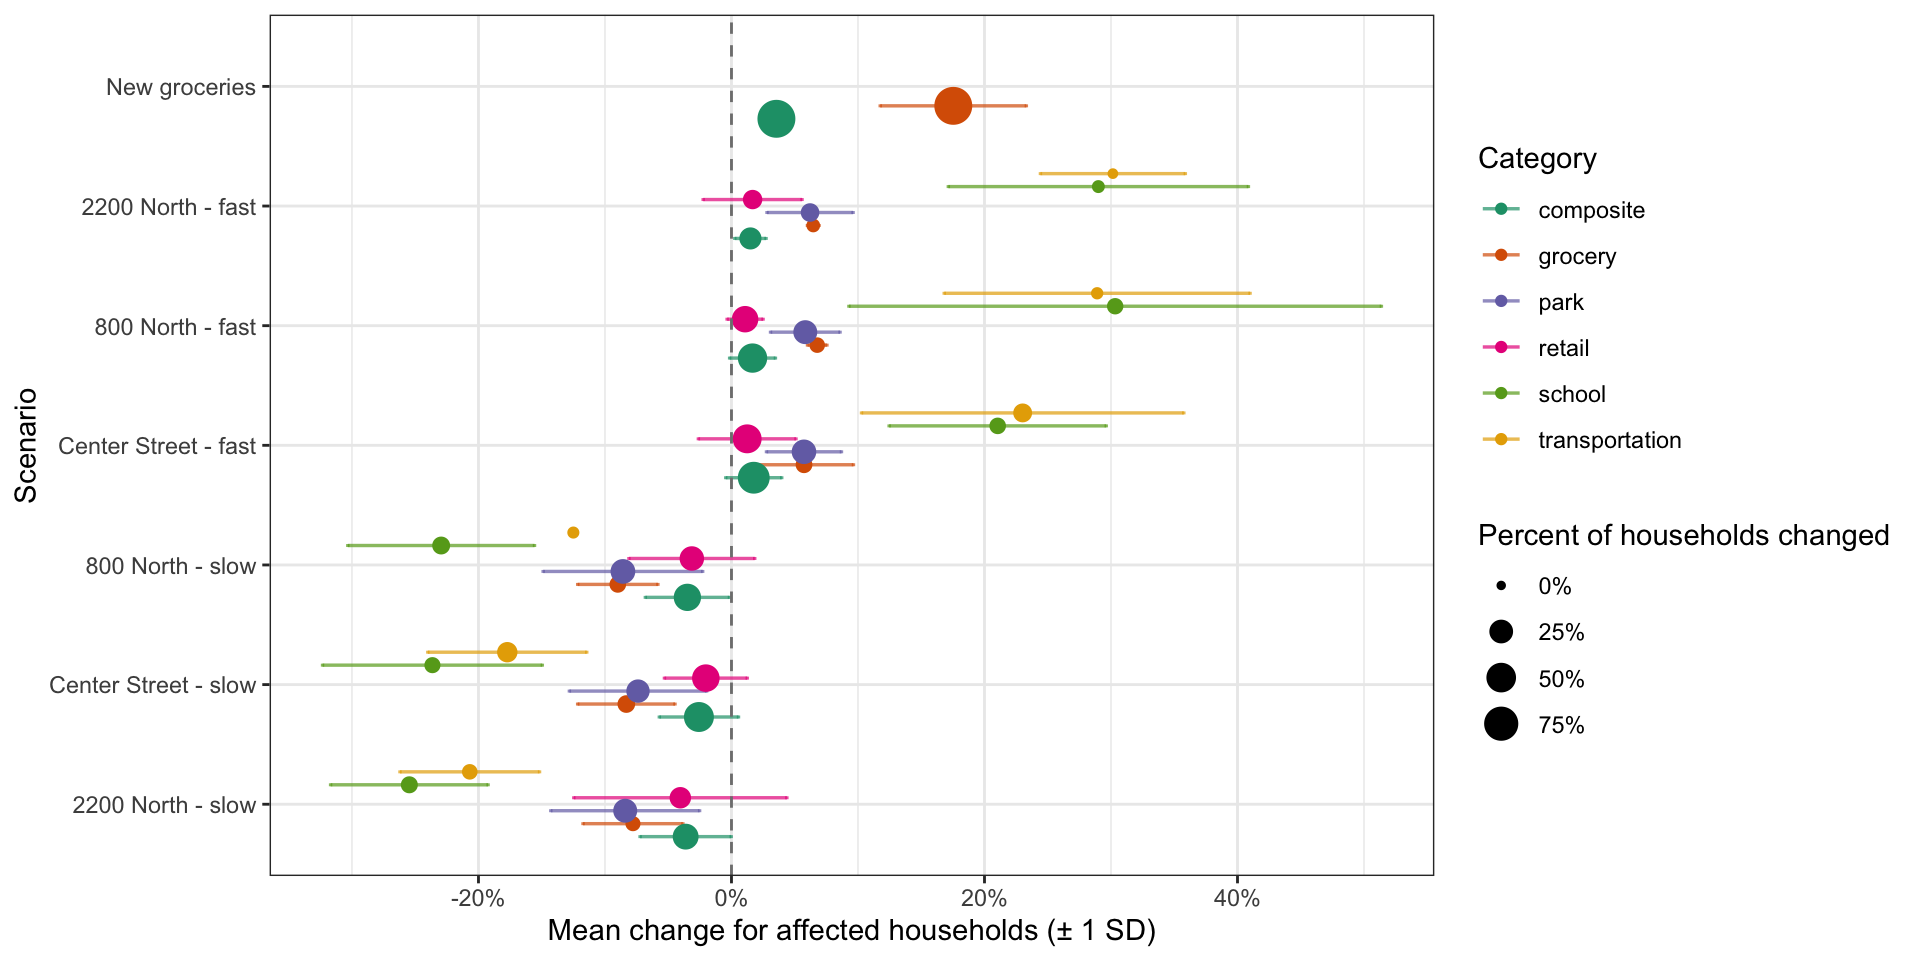
New Grocery Stores

Summary

Limitations

Reasonable minds can disagree about which POIs to include, how far away they should be, and how to weight them.

Not all grocery stores are the same, etc.

This only considered vehicle travel, with somewhat dramatic LOS changes.

These are hypothetical, not realized trips. Can do that analysis with activity-based model (coming soon).